Tutorial
version 1.0b18
February 2007
Human-Computer Interaction Institute
School of Computer Science
Carnegie Mellon University
Contributors to the CogTool Project
- Bonnie E. John Gus Prevas
- Peter Centgraf
- Ken Koedinger
- Dario Salvucci
- Sandy Esch
- Alex Eiser
- Mike Horowitz
- Leonghwee Teo
- Jason Cornwell
- Don Morrison
- Samantha Konwinski
- Alex Faaborg
- Carmen Jackson
- Lily Cho
This research was supported by funds from the Office of Naval Research, N00014-03-10086. The views and conclusions contained in this document are those of the authors and should not be interpreted as representing the official policies, either expressed or implied,
of the Office of Naval Research or the U. S. Government
Conventions For This Tutorial
NOTES about CogTool 1.0b18:
⬜️ This document is about CogTool 1.0b18, but other releases will follow. When some behavior is specific to CogTool 1.0b18 and is expected to change in a future release, a note appears in a gray box like this one.
KNOWN BUGS in CogTool 1.0b18:
🟨 When there is a known bug in CogTool 1.0b18, it is indicated with a note in a yellow box like this one.
This tutorial demonstrates an example of using CogTool to make a prediction. Therefore, it discusses only the aspects of CogTool that are necessary for completing this example. If you have additional questions, please consult the full CogTool User Guide.
Terms in this guide that are CAPITALIZED (in this fashion) refer to the items that are created and edited in CogTool. If the conventional English definition is intended, the words will have no special formatting.
System Requirements
CogTool is a cross-platform application. Unless otherwise noted, instructions are identical whether CogTool is running on Mac OS X or Windows-based computers. Screen images of CogTool in this guide are taken from a Macintosh; only minor visual differences exist between these images and the PC.
CogTool is compatible with MacOS X 10.4 and above including Intel Macs (i.e., those shipped after December 2005). It is also compatible with Microsoft Windows XP. CogTool will function on older versions of Windows (down to Windows 98) but requires the GDI+ library, which you can install from Microsoft at http://www.microsoft.com/msdownload/platformsdk/sdkupdate/psdkredist.htm.
Table of Contents
1.1 What does CogTool do for me? 6
1.3 The Example: ChoiceWay™ Guide to New York City for Palm OS® 7
2 Creating a DESIGN storyboard 8
2.1 Prepare Tutorial Materials 8
2.8 Link FRAMES via TRANSITIONS 18
3 Demonstrate a TASK and Produce a Prediction 22
4 Extending a DESIGN to Support Multiple TASKS 30
4.3 Demonstrate a Second SCRIPT 32
6.1 Capturing Backgrounds to Move Widgets 34
6.2 Understanding the Predictions 34
CogTool Overview
What does CogTool do for me?
Predicts execution time of a skilled user.
CogTool predicts total execution time for a skilled user performing a particular sequence of actions on a system.
The predictions made by CogTool are based on a psychological theory of human cognitive and motor capabilities, called the Keystroke-Level Model (KLM), which has been used and validated repeatedly by academics and practitioners since 1980 (Card, S. K., Moran, T. P., & Newell, A. The keystroke-level model for user performance time with interactive systems. Communications of the ACM, 23 (7), (1980) 396-410). CogTool automates the application of KLM to specific problems, providing an alternative to time-consuming and expensive user testing.
CogTool can only predict what KLM can predict, that is, execution time for a skilled user of a system. It cannot predict learning time, problem-solving paths, or user satisfaction with a system. It also cannot predict the path of hurricanes.
Produces a “reusable” design mock-up that is as useful for user testing with novices as it is for predicting skilled performance time
When you use CogTool to predict skilled performance time, you create a storyboard of a system design that can be exported to HTML and used in user tests. A discussion of multipurpose prototypes can be found in; John, B. E. & Salvucci, D. D. (2005) Multi-Purpose Prototypes for Assessing User Interfaces in Pervasive Computing Systems. IEEE Pervasive Computing 4(4), 27-34.
How do I make it work?
This section gives a brief overview of the stages of using CogTool. Subsequent sections will explain each item in more detail.
Install and Launch CogTool
This guide assumes that you have downloaded and installed CogTool 1.0b18 from http://www.cogtool.org/download.html. If you have not yet done so, please visit the Download page of the CogTool website and follow the instructions now. Sections 2.1 and 2.2, provides more details.
Create a PROJECT
In CogTool, a PROJECT is the center of your work and contains the user interface DESIGN and the TASK for which you would like to make predictions. Therefore, the first step in working with CogTool is to create a PROJECT. Section 2.3 has more information on how to work with PROJECT.
Create a DESIGN Storyboard
The interfaces that you want to make predictions about are expressed in storyboards. Sections 2.5 thru 2.8 describe how to create a storyboard for the interface DESIGN upon which TASKS will be performed.
Define TASKS
Once the storyboard for your DESIGN has been created, you will define a set of TASKS whose performance you would like to predict. Section 3 of this guide will show how to create TASKS and use TASK GROUPS to organize them.
Record a SCRIPT
The steps a user would perform to accomplish a TASK are recorded in SCRIPTS. Section 3.1 shows how to record a SCRIPT of specific user actions by demonstrating them on the DESIGN you created in Sections 2.5 thru 2.8. Once the SCRIPTS are defined, CogTool will make its predictions.
Rinse, Repeat!
Creating a DESIGN, a set of TASKS, and SCRIPTS is the starting point for creating new DESIGNS, exploring different TASKS, and comparing the predictions. With a basic familiarity with CogTool, you now have a great new tool for improving your user interface designs. Section 4 discusses best practices and helpful tips for getting the most out of CogTool.
The Example: ChoiceWay™ Guide to New York City for Palm OS®
To help guide you through the process of using CogTool, we will be working with an example user interface: the ChoiceWay™ Guide to New York City for Palm OS®. This software provides a directory of attractions in New York City for Palm OS®-based handheld devices. The storyboard and tasks are adapted from those used by Luo and John in their 2005 paper.1 This tutorial will show how to predict the performance time for two simple tasks using that interface: looking up the stored information for the Metropolitan Museum of Art.
Creating a DESIGN storyboard
The first step of working with CogTool is to create a storyboard of a user interface design. This storyboard will show the individual screens of the user interface, the interactive elements on those screens, and the user actions that trigger changes from one screen to another. In CogTool, a storyboard like this is referred to as a DESIGN.
In this tutorial, we will be building a DESIGN that is sufficient to demonstrate one specific
TASK. Here is a zoomed-out view of what our final storyboard will look like: (Figure 1)
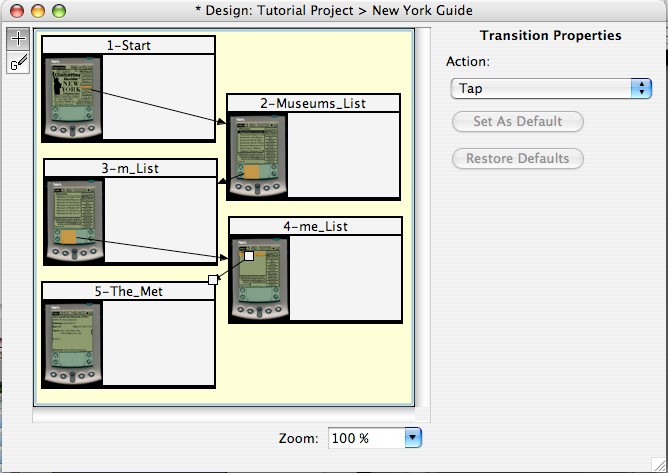
Figure 1. Storyboard for the ChoiceWay™ Guide to New York City that illustrates a museum look-up task (the subject of this tutorial).
The TASK will be to lookup information about the Metropolitan Museum of Art in the ChoiceWay™ Guide to New York City for Palm OS®, using these steps:
- Tap the button labeled “Museums” on the first screen of the ChoiceWay™ Guide to New York City
- Use Graffiti® to enter the characters “m” and “e” into a live search field.
- Tap the list item labeled “Metropolitan Museum of Art”
2.1 Prepare Tutorial Materials
Before we begin work, let’s gather some materials that we’ll need. The link below leads to a zip format archive containing screen captures of the interface we’ll be mocking up. Download the archive to your computer and expand the contents. On the Macintosh, some browsers will automatically expand downloaded archives. Otherwise, simply double-click the archive to expand it. A folder containing JPG-format image files should be created at the same location as the saved archive. On Windows, you may need to use a zip archive utility such as WinZip to expand the archive. On Windows XP, you may double-click the archive to expand it. Remember where the archive has been expanded, because we will need the contents later in this section.
[http://www.cogtool.org/software/tutorial-images.zip]
2.2 Launch CogTool
Open the CogTool application that you’ve previously installed. If you haven’t installed it yet, follow the instructions at [http://www.cogtool.org/download.html.] If you are working on a Windows-based PC, CogTool should have a folder in the Start Menu. If you are working on Mac OS X, CogTool will be wherever you placed it after extracting it from the download archive.
2.3 Create a PROJECT
A PROJECT contains the user interface DESIGNS, the TASKS being studied and the SCRIPTS that define the performance being predicted. A PROJECT is a center of work. All the parts necessary for CogTool to make performance predictions is kept in a PROJECT file. The PROJECT name is also the name of the .cgt file that is created by CogTool. You are asked to name the PROJECT file at the first Save.
When you launch CogTool, a dialog box appears and gives you the choice of creating a new
PROJECT or opening an existing one (Figure 2). To follow the tutorial click the “Create” Button.
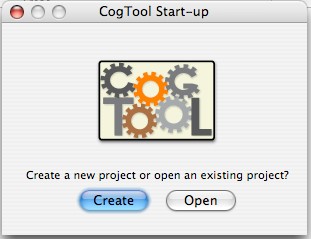
Figure 2. The CogTool Start-up box that appears when CogTool is launched
Since all PROJECTS must have at least one DESIGN a New Design dialog box will appear asking you to “Please enter the name of an initial design” and the default name will be highlighted ready for you to type in a more appropriate name. (Figure 3)

Figure 3.The New Design box that appears when a new PROJECT is created.
You may choose any name you wish. For the tutorial, we used “New York Guide.” This dialog box also asks which devices will be used with the DESIGN. In this case, the
DESIGN is for a Palm®, so the only device needed to be checked is the touch screen device. Confirm your choice by pressing “OK” or hitting the enter key

Figure 4. “New York Guide” appears as the DESIGN name
The new DESIGN appears as a new column in the PROJECT window with the name you specified (Figure 5). Since all DESIGNS must have at least on TASK, a new TASK is also created with a default name highlighted and ready for a more appropriate name to be entered.

Figure 5. DESIGN name “New York Guide” appears as a column heading. “Task 1” is highlighted and ready for a new name.
To follow the tutorial call the first task “Lookup the MET” (Figure 6).

Figure 6. “Lookup the MET” appears as a TASK name.
2.4 Save the PROJECT
Now save the PROJECT by selecting the “Save” command in the “File” menu. A standard
Save dialog box comes up to ask for a file name and location. Call this file “Tutorial Project.cgt”. You’ll notice that the file name (without the extension) now appears in title bar of all windows associated with this PROJECT (Figure 7).
When a PROJECT has been changed from a saved state, an asterisk appears in each window title bar. For example, Figure 6 was before we saved the project, and it has an asterisk; Figure 7 shows the window after we saved the project and there is no asterisk.

Figure 7. The PROJECT has been saved as “TutorialProject”. Notice that no asterisk appears in the window title.
2.5 Open the DESIGN
Now you must open the DESIGN so you can create the DESIGN storyboard for the New York Guide. You may double-click on the name of the DESIGN, or you may click on the name once to select it and then choose the “Edit” command from the “Edit” menu, or select “Edit” from the DESIGN name’s contextual menu. The SCRIPT cell below the DESIGN name will highlight, and a dot will appear next to the DESIGN name, to show that the DESIGN is selected (Figure 8).

Figure 8. The “New York Guide” DESIGN has been selected, which is indicated by the dot next to the DESIGN name.
2.6 Add FRAMES
When the new DESIGN window opens a new FRAME is automatically created (Figure 9).


Figure 9. The DESIGN window for the “New York Guide” DESIGN has a single FRAME automatically placed in it
At this point, we could add content to Frame 1 and add new FRAMES one at a time. However, we know we are going to have five FRAMES in the “New York Guide” DESIGN and already have images that we want to place inside the FRAMES. Adding each FRAME one at a time would be slow, but we can use the “Import Frame Background Images” command to automatically create a FRAME for each image in the folder and place the image in the FRAME as the background. Select the “Modify” menu, then the “Import Frame Background Images” from the drop down list (Figure 10)


Figure 10. Selecting the “Import Frame Background Images” command from the Modify menu in the “New York Guide” DESIGN window.
Navigate through the “Select a directory of images” dialog box to the “tutorial-images” folder you down loaded (See 2.1 Prepare Tutorial Materials). Select the folder and then hit the “Choose” button (Figure 11).


Figure 11. “Select a directory of images” dialog box for importing background images from a folder into FRAMES.
Your “New York Guide” DESIGN window should appear as in Figure 12.

Figure 12. The “New York Guide” DESIGN window after the “tutorial-images” files were imported as background images for new FRAMES.
KNOWN BUG #1. When FRAMES are stacked, the stacking order is mysterious and may even seem to change over time. Work around: move the FRAMES apart so they are not stacked.
You will need to see each FRAME in its entirety so it’ll be necessary to move the FRAMES apart. Simply press the left mouse button inside the body of a FRAME, drag the mouse to the new location, and release the mouse button. Make your DESIGN window resemble Figure 13.

Figure 13. “New York Guide” DESIGN window after five FRAMES have been created using the “Import Background Frame Images” command and have been rearranged so that the entirety of each FRAME could be seen.
2.7 Define WIDGETS
In order to interact with your DESIGN storyboard, you must define WIDGETS on each FRAME for each interface element that the user would manipulate in a TASK, e.g. buttons, check boxes, radio buttons, or menus. In CogTool, a WIDGET is a “hot-spot” that you create in a FRAME to indicate the area that is interactive on the actual physical device.
In this tutorial, the first step of our TASK is to tap the “Museum” button on the FRAME called “1-Start”. Therefore, we need to define a WIDGET for the “Museums” button. (In general, there is no need to create WIDGETS for every element of the original interface, only for those needed for the tasks you want to investigate.) On the screen shot of the PalmPilot the area on the screen under the words “Museum” is the area our first WIDGET is to represent. To create the WIDGET, open FRAME “1-Start” by double clicking on the FRAME in the DESIGN window (Figure 14).
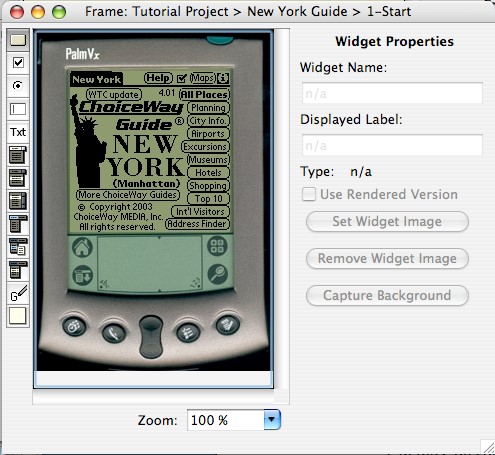
Figure 14. FRAME 1_Start. The WIDGET toolbar is along the left side. The FRAME on which to place WIDGETS is in the center (in this case, it has the first screen of the New York Guide Palm application as its background). The WIDGET property pane is on the right side (it is grayed out in this figure because no WIDGET is selected).
It is important to select the proper type for a WIDGET so thatCogTool can make accurate predictions. The type is based on its function in the interface. Different values are used for different types of user interface elements, such as the “List Box Item” type for each row of a list box, the “Menu” type for the menu header in a menu bar, the “Menu Item” type for individual menu items, and the “Pull-Down List” and “Pull-Down Item” types for interface elements that allow you to select a single item from a list of items (sometimes referred to as a “combo box”). See Table 1 in the CogTool Users Guide for a list of the WIDGETS supported by CogTool and guidelines for when to use each WIDGET.
 Button
Checkbox
Radio Button
Text Box
Text itself, e.g. text you would select to delete or copy
Pull-Down List (when it is closed, interacting with this widget opens it)
Pull-Down List Item (a thing that can be selected in a pull-down list)
List Box Item (when the entire list is visible all the time)
Menu header
Submenu
Menu Item (of either a Menu header or a Sub-menu)
Graffiti™ area
Non-Interactive area, that someone could look at by not act on.
Figure 15. Types of WIDGETS and the tools that insert them. See the CogTool User Guide (p. 45) for more detailed descriptions and examples of each type of WIDGET.
 The widget needed in Frame “1-Start”
needs to function as a button (see examples in Table 1 of the CogTool
User Guide, p 45). The button tool at the top of the toolbar is
selected by default when you open a FRAME. Make sure this tool is
selected (it will be outlined in a darker shade of gray than the other
tools).
The widget needed in Frame “1-Start”
needs to function as a button (see examples in Table 1 of the CogTool
User Guide, p 45). The button tool at the top of the toolbar is
selected by default when you open a FRAME. Make sure this tool is
selected (it will be outlined in a darker shade of gray than the other
tools).
 Create a WIDGET over the area of the “Museums”
button on the background image by dragging a rectangle across that
area of the FRAME. Do this by pressing the left mouse button,
moving the mouse over the area you wish to select, and then releasing
the mouse button.
Create a WIDGET over the area of the “Museums”
button on the background image by dragging a rectangle across that
area of the FRAME. Do this by pressing the left mouse button,
moving the mouse over the area you wish to select, and then releasing
the mouse button.

 As an alternative, you could also use the “New WIDGET…” commandin the “Create” menu, which will place a WIDGET in the upper left corner of the FRAME. You then move and resize the WIDGET to the appropriate position.
Move a WIDGET by pressing with the left mouse button on the translucent area of the WIDGET and dragging the mouse to the new location. To more precisely position a WIDGET, use the Nudge commands available in the Modify menu or in the contextual menu available on the WIDGET. You can also use the arrow keys to nudge a selected WIDGET into place.
Resize a WIDGET by clicking and dragging the small white square handles at the corners of a selected WIDGET.
You may zoom in and out on the background image to make placing WIDGETS easier. These commands are available in the “Modify” menu or in the contextual menu that pops up for the FRAME background. (You may open the contextual menu by clicking the background of the FRAME with the right mouse button. On a Mac, you click with the left mouse button while holding the CTRL key.) The “Zoom to Fit” command is particularly useful, making the background image exactly fit the available space in the window. The keyboard shortcuts for Zoom-to-Fit are apple-/ for Mac and CTRL-/ for PC. You can also zoom to preset percentages by selecting the desired percentage in the “Zoom” field in the bottom portion of the FRAME.
2.7.1 Set WIDGET Properties
The property pane on the right side of the FRAME window shows the properties of the selected WIDGET. Each WIDGET must have a unique name. A WIDGET name can be used by only one WIDGET on a particular FRAME. For this WIDGET, use the name “Museums”. You may use any text you wish for the name of a WIDGET.
A WIDGET can simply be a hot-spot over a background image, as is the case with this Museums button, or you can check the Use Rendered Version checkbox. This puts a thin border around the hotspot, so you can see the button when there is no background image. (In future versions of CogTool, there will be rendered images for Mac, PC and Palm platforms.) When you use a rendered version, the Displayed Label textbox allows you to enter text that will be displayed on the WIDGET. Since our frame has a background image with the word “Museums” already on it, we will leave the checkbox unchecked and the textbox blank. ( Figure 16). A WIDGET can also have its own image (set with the Set Widget Image button) or capture the background image (see the last section of this tutorial), but these features are unnecessary for this tutorial.


Figure 16. A WIDGET, Type: Button, has been placed over the image of the Museums button on the Palm Pilot and named “Museums”.
A FRAME can have many WIDGETS to mock-up as much of the interactivity of a DESIGN as you would like. In this task, we only need a single WIDGET on this FRAME, so we are now done with this FRAME. Close the FRAME window and return to the DESIGN window. The DESIGN window will reflect the changes you have made to the “1-Start” FRAME by showing the orange hotspot on the Museum button (Figure 17).

Figure 17. The DESIGN window reflects the changes made to the”1-Start” FRAME.
2.7.2 Add Content to All FRAMES
Repeat the process described above to add the necessary WIDGETS to all FRAMES of the storyboard, as follows.
NOTE #1. When you have two actions in a row that act on the same WIDGET, like the two Graffiti strokes in the tutorial task, it is important for the two WIDGETS to be absolutely identical. The only way be sure that two WIDGETS are absolutely identical is to create one and then copy it onto all the other FRAMES that need that identical WIDGET. All properties, including the name and type will be copied
NOTE #2. If you accidentally didn’t have the correct WIDGET type selected before you create your WIDGET, you must delete the WIDGET, select the correct WIDGET type with the toolbar button on the left, and recreate the WIDGET.
[In FRAME ] [Placed over]
1-Start Button the area labeled “Museums”
(Already completed)
2-Museum_List Graffiti letter input area (Figure 18)
3-m_List Graffiti® letter input area (Figure 18)
(don’t forget to copy this WIDGET from the previous FRAME)
4-me_List List Box Item the area labeled “Metropolitan Museum”
5-The Met no WIDGETS are needed in this FRAME

Figure 18 Graffiti® type WIDGET is placed over the image area that represents where a user would mark Graffiti® gestures for letters.
Your design window should look like Figure 19.


Figure 19. All FRAMES in the DESIGN are populated with background images and
WIDGETS sufficient to do the TASK.
2.8 Link FRAMES via TRANSITIONS
We have now created all of the FRAMES of the storyboard for this DESIGN. However, the
DESIGN is only complete when multiple FRAMES are linked together to follow the series of steps in a TASK. The links between FRAMES are called TRANSITIONS and each represents a user action on the interface that causes a new FRAME to appear. For example, when the user taps on the “Museums” WIDGET on the “Start” frame, we want the “Museums List” FRAME to appear.
2.8.1 Create a TRANSITION
To create a TRANSITION from the “Museums Button” WIDGET to the “Museums List” FRAME, press the left mouse button on the WIDGET that will cause the TRANSITION to occur, drag the cursor to the destination FRAME so that it highlights (Figure 20), and then release the mouse button. An arrow will connect the WIDGET to an edge of the destination FRAME.
If you have trouble clicking on WIDGETS because they are too small, use the “Zoom” commands in the “Modify” menu.

Figure 20. Creating a transition by dragging from the “Museums Button” WIDGET in the “1_Start” FRAME to the “Museums List” FRAME. The destination FRAME highlights by turning gray.
2.8.2 Edit TRANSITION Properties
Like WIDGETS, TRANSITIONS have properties that can be configured in the panel on the right side of the DESIGN window. Each TRANSITION is triggered by a specific user action. For example, a design using a touch-screen can TRANSITIONS triggered by tap or double-tap on a particular button WIDGET. Each type of WIDGET can respond to different types of user actions, and therefore different TRANSITIONS have different properties. When a new TRANSITION, or an existing one, is selected, the Action field will have the available properties.
Figure 21 shows the actions available for touch screen (Tap, Double-Tap, and Hover, because some touch-screen can detect fingers hovering above their surface). Figure 22 show the single action available for Graffiti® “Graffiti® Gestures:”. A Graffiti® gesture also has a property of being a command (the “Is Command” box must be checked) or not (the “Is Command” box must be empty).


Figure 21. The type of transitions available for a touch screen.

Figure 22. Graffiti® gestures are either text or commands. Both types are entered into the text box. To indicate a command check the box on the right.
Now add TRANSITIONS for each step in the TASK as follows:
[From WIDGET in FRAME ] ——————————————— ————————————————- 1-Start 2-Museums_List Tap 2-Museum_List 3-m_List Graffiti® gesture “m” 3-m_List 4-me_List Graffiti® gesture “e” 4-me_List 5-The_Met Tap
NOTE #3. To indicate a command that requires two gestures (e.g., many commands start with a gesture that looks like a /), please use “/” before the letter of the command. Therefore the gesture command for Cut would be “_x”, for Copy would be “_c”, for Paste would be “/v”, etc. In addition, check the Is-Command check-box to tell CogTool that these gestures constitute a command.
NOTE #4. A “self transition” can also be made. You would use a self-transition if the user’s action did not change the look of the interface your are mocking up, or if you want to use one FRAME to demonstrate many actions and you don’t care that the look of the interface doesn’t change during this part of the demonstration. To make a self-TRANSITION, simply click on the WIDGET that triggers the self-TRANSITION and drag a short distance off that WIDGET but still on the frame, then release the mouse button. An arrow will go from the WIDGET to the edge of FRAME to indicate the self-TRANSITION.
When you are finished, your storyboard should look like Figure 23 below. You can now close the DESIGN window to return to the PROJECT window.

Figure 23. TRANSITIONS complete. The TRANSITION in Frame “4-me_List” is selected.
The entire DESIGN is finished at this point and is sufficient to demonstrate the TASK of looking up the MET.
3 Demonstrate a TASK and Produce a Prediction
CogTool needs three ingredients for each prediction: an interface DESIGN, a TASK, and a
SCRIPT of actions. In Section 2 we named the task “Lookup the MET” and created the New York Guide DESIGN using FRAMES, WIDGETS, and TRANSITIONS. This section shows how to demonstrate a TASK to create a SCRIPT of actions.
3.1 Open a SCRIPT
A SCRIPT is opened by double-clicking on the cell at the intersection of a TASK and a DESIGN. You may also open the contextual menu for a script by clicking the right mouse button in the cell. (On a Mac, click while holding the CTRL key.) Then, choose the “Edit SCRIPT” command from the contextual menu (Figure 24).

Figure 24. Edit the SCRIPT by using the contextual menu.
3.2 Choose a Start FRAME
Since a SCRIPT may begin at any FRAME in the DESIGN, you must select the start FRAME separately for each SCRIPT. To select the start FRAME, double-click on a FRAME (Figure 25) or its name in the list at the left. You may also click the desired FRAME to select it, and then press the “Start Demonstrating Task” button or the Enter key. In this tutorial, we called the first FRAME in this the Look-up-the-Met task the “1-Start” FRAME. Double-click on the “1Start” FRAME to begin. The FRAME-chooser window will be replaced by the main SCRIPT editor window.


Figure 25. The initial SCRIPT window with the “1-Start” FRAME selected.
3.3 Demonstrate Actions
In the SCRIPT editor window, you will interact with the DESIGN to record a sequence of SCRIPT STEPS in a SCRIPT. The beginning FRAME appears in the left pane, and the current list of STEPS in the SCRIPT appears in the right pane. A set of buttons for manipulating the SCRIPT is located at the bottom of the window.
As with the FRAME and DESIGN windows, you may use the “Zoom” commands to make your work easier. The “Zoom” commands can be found in the “Modify” menu or in the contextual menu for the FRAME. Use the “Zoom to Fit” command now to make your window look like Figure 26 below.

Figure 26. The SCRIPT editor window.
To record new STEPS, interact with the storyboard as a user would interact with an actual device. In the case of a touch screen interface like a Palm OS®-based handheld, CogTool automatically interprets mouse clicks that you make in your demonstration as taps that a user would make on a Palm. The TRANSITIONS associated with your actions will be followed automatically. That is, the current FRAME will be replaced with the destination FRAME of the TRANSITION. For each action you perform, a new STEP will be added to the SCRIPT.
Click on the Museums button now to demonstrate the first STEP in the TASK. The window changes to look like Figure 27.

Figure 27. Result of demonstrating the first STEP in the TASK.
In the SCRIPT STEP list on the right, CogTool has put three STEPS in response to the single action demonstrated (clicking on the “Museums Button”). They are a “Think” action for 1.2 seconds, a “Look At” to find the “Museums Button”, and a “Move and Tap” action to the “Museums Button”. Think and Look-at STEPS are inserted automatically because prior research in psychology and human-computer interaction has shown that when people tap on a button, they think to remember which button to press, they look at the button, and then they tap that button. The tap results in the FRAME changing to the “Museums List” FRAME, which is now shown on the left and listed as the last line of the SCRIPT STEP List. Automatically inserting Think and Look-at STEPS is an important part of CogTool’s functionality. By doing this automatically, CogTool allows analysts to produce valid models whether they have studied psychology or not. The placement of Think and Look-at STEPS is backed by decades of psychology research and HCI data and is at the core of the research that produced CogTool.
The STEPS that are inserted automatically are shaded in yellow to distinguish them from STEPS deliberately demonstrated by the analyst (white STEPS). All of the yellow STEPS above a white STEP are associated with that white STEP. If a white STEP is deleted, all its yellow STEPS will be deleted as well.
If you have difficulty remembering which TRANSITIONS are associated with which WIDGETS, hold the mouse over a WIDGET to display a tool-tip. You can also use the WIDGET’S contextual menu to select a specific TRANSITION (Figure 28).


Figure 28. Contextual menu on the Graffiti® WIDGET.
When a TRANSITION is a tap or double-tap, you can demonstrate the STEP simply by performing the action on the WIDGET (tap or double-tap). If the TRANSITION is some other type, you must open the contextual menu on the WIDGET and select the action you want to perform to record a STEP. Figure 28 shows the contextual menu displaying the choices for the next STEP: entering Graffiti® strokes “m” on the Graffiti® Letter WIDGET, looking at the Graffiti® Letter WIDGET, or entering new text into the Graffiti® Letter WIDGET. Select “Perform Enter Graffiti® Strokes m On Letter Input” as the next STEP in our TASK which results in the screen shown in Figure 29.


Figure 29. Two STEPS have been demonstrated.
3.3.1 System Delays
An accurate prediction of user task time must include time spent waiting for the system to complete requested actions. Sometimes systems are so fast that system delays are negligible and you don’t need to include waiting time, but sometimes (as in the case of this Palm app), the delays are noticeable. To simulate a system delay, press the “Wait for System” button, and then enter the amount of time in seconds the user will wait.
You can insert system delay in two ways, while you are demonstrating the STEPS or after a STEP has been demonstrated.
In the task we are currently demonstrating, there is actually several seconds of system delay time between the tap on the Museums Button and the display of the 2-Museums_List FRAME. Since we have already demonstrated that STEP, we can now go back and insert the system delay.
The first system delay is 3.82 seconds (this system delay was actually observed in videotapes and log files of the application). Select the first occurrence of the delayed screen, i.e., the first line in the SCRIPT STEP list where the FRAME is 2-Museum_List. Figure 30 shows this line selected, indicated by the blue highlighting.

Figure 30. The first occurrence of the delayed FRAME is selected.
Then hit the “Wait for System” button below the displayed FRAME. A dialog box comes up asking for the duration of the delay. Figure 31shows 3.82 seconds being entered into this dialog box.

Figure 31. The system delay is entered.
After you hit the OK button (or the Enter key), the system delay is entered into the SCRIPT STEP List in between the last action on the “Start” FRAME and the first action on the “2Museums_List” FRAME, as shown in Figure 32.

Figure 32. The result of entering system delay before the 2-Museums_List FRAME.
We can continue with the demonstration by selecting the last line in the SCRIPT STEP List.
Enter the next STEP through the contextual menu on the Graffiti® area (enter an “e”).
During actual observation after that character was entered, another system delay was observed, this time for 3.76 seconds. For our demonstration purposes this time, we can enter the system delay in the process of demonstrating the TASK. Right after the STEP that caused the delay is entered, (entering an “e” in using the Graffiti® area) simply hit the “Wait for System” button and enter the duration and CogTool will place the system delay correctly, as shown Figure 33.

Figure 33. The system delay appears in the correct position when entered after the step that caused the delay during the demonstration
Continue demonstrating the TASK, adding 2.62 seconds of system delay before the last screen appears, and the final STEPS SCRIPT List is shown in Figure 32.

Figure 34. Final SCRIPT.
3.4 Review and Edit Steps
Now that you have demonstrated all the steps that comprise the task of “Look-up the Met”, spend just a few minutes, to check to make sure the actions are in the correct order and that the frames were properly linked together.
3.4.1 View Previous STEPS
You may view the FRAME being used in a particular SCRIPT STEP by clicking on the STEP in the history list.
3.4.2 Recovering from a Mistake when Demonstrating STEPS
CogTool 1.0b18 does not allow you to recover from a mistake when you are demonstrating STEPS in a TASK. The development team is working hard to fix this obvious deficiency in upcoming releases, until thenyou must delete each step and start your demonstration over. Fortunately, demonstrating STEPS doesn’t take very long for most TASKS.
KNOWN BUG #2. The CogTool interface looks like it can change STEPS in the middle of a TASK successfully, but it does not produce reliable human performance predictions if you do. It does not reliably tell you that it is not producing a reliable prediction. This is a serious bug and the development team is working on it. To be safe, always delete an erroneous SCRIPT completely and re-demonstrate the STEPS. Likewise, if you change the design after demonstrating a TASK, re-demonstrate the STEPS.
3.5 Compute Predictions
Once you have finished creating the SCRIPT, press the “Close and Compute” button to return to the PROJECT window and compute a prediction. The result will appear as a value in the table cell for the SCRIPT (Figure 35).

Figure 35. Predicted task execution time appears in the PROJECT window.
That’s all there is to it! You can read the value directly out of the table cell for the SCRIPT.
NOTE #5. Do not worry if the predictions in your model are slightly different than the ones shown in this tutorial document. The predictions depend on the exact size and position of the WIDGETS and yours are unlikely to be exactly the same as ours. However, if they are off by more than a few tens of milliseconds, you might compare your designs to ours to see if there are major differences.
NOTE #6. If the computation process has an error, it will often return either “0.000” or “600.000” as the answer. This is NOT a correct prediction! If you get an erroneous result, please check your DESIGN and SCRIPT.
4 Extending a DESIGN to Support Multiple TASKS
Now that we have used CogTool to create a single DESIGN and TASK, we can extend our work to support a second TASK. A strength of the Keystroke-Level Model type of cognitive performance modeling, employed by CogTool, is the ability to compare alternatives. To this end, we will use CogTool to predict the time for an alternate way to complete the “Lookup the Met” TASK. We will follow the same basic steps outlined in Sections 2 and 3 to model the following new steps.
- Tap the button labeled “Museums” from the first screen.
- Tap the on-screen keyboard to enter the characters “m” and “e” to filter the museums.
- Tap the list item labeled “Metropolitan Museum of Art”
4.1 Extend the DESIGN
To perform the new variation of the TASK, you need to add two WIDGETS to the DESIGN:
[In FRAME ] [Placed Over]
2-Museum_List Button the on-screen keyboard “M”
3-m_List Button the on-screen keyboard “E”
To add new WIDGETS to a DESIGN, open the DESIGN window, and then the FRAME windows for the FRAMES you wish to edit.
Similarly, you will need to add two new TRANSITIONS to reflect the alternative path through the storyboard:
[In FRAME ] [To FRAME]
2-Museum_List over “M” 3-m_List Tap
3-m_List over “E” 4-me_List Tap
When you have finished your modifications, the DESIGN should look like Figure 36.

Figure 36. Augmented design that can now support two tasks.
Now, close the DESIGN window to return to the main PROJECT window.
4.2 Add a Second TASK
Now that the DESIGN has the necessary additions to support the second variation of “Lookup the MET”, let’s add a TASK to the PROJECT for that variation. Use the “New Task” command in the “Create” menu (Figure 37). Call it “Lookup the MET – Soft Keyboard.”

Figure 37. “New Task” command in the “Create” menu.
To distinguish the old version of the TASK from the new one, double click on the old TASK name and rename it to be “Lookup the MET – Graffiti”.
Now, since both these TASKS accomplish the same goal of finding the information about the MET, we will put them in a TASK GROUP. Select both TASKS and then select the “New Task Group” command from the “Create” menu (above). Call the task group “Lookup the MET”. When this is done, the PROJECT window should look like Figure 38.

Figure 38. A group of tasks that both accomplish the goal of looking up information about the Metropolitan Museum of Art (the MET).
By default, the computation assigned to a group of tasks is the sum of all the tasks in the group. This is useful when the tasks in the group are subtasks of the task group because their sum would then be the total time for the whole task. However, in this case, the two tasks are alternative methods for accomplishing the same goal. Therefore, we may want to see the mean, minimum or maximum time for accomplishing this goal. To change the computation displayed for the TASK GROUP to one more meaningful for this tutorial, choose the “Show Minimum” option in the “Modify” menu (Figure 39) to get the results in Figure 40.

Figure 39. Other options for the contents of TASK GROUP cells.

Figure 40.Calculation changed to showing the minimum time for a TASK GROUP.
4.3 Demonstrate a Second SCRIPT
Finally, to compute the prediction of the second TASK’S performance time, we need to demonstrate the steps of the SCRIPT. Open the SCRIPT window by double-clicking the table cell at the intersection of the “New York Guide” DESIGN and “Lookup the MET– Soft Keyboard” TASK. In the FRAME chooser window, select the “1-Start” FRAME. Demonstrate the steps of the new TASK by clicking on the appropriate WIDGETS, in this sequence:
- “1-Start” FRAME: tap the button labeled “Museums”
Insert a system delay of 3.82 seconds
-
“2-Museums_List” FRAME: tap the on-screen keyboard character “M”
-
“3-m_List” FRAME: tap the on-screen keyboard character “E”
Insert a system delay of 3.76 seconds
- “4-me_List” FRAME: tap the list item labeled “Metropolitan Museum of Art” Insert a system delay of 2.62 seconds
When you have completed these SCRIPT STEPS, press the “Close and Compute” button on the SCRIPT window to close the window and compute the prediction. When you have done this, the PROJECT window should look like Figure 41.

Figure 41. The PROJECT window is populated with the desired predictions.
As you can see, the Soft Keyboard method is about 0.1 seconds slower than the Graffiti® method, a mere 0.7% of the total time. However, the magnitude of the total time is heavily influenced by the more than 10 seconds of system delay observed in the application. If you want to see how much time is contributed just by using the soft keyboard, behavior that might be obtainable if the application were made much faster, edit the scripts by deleting the wait-for-system steps and re-compute – its just that easy!
NOTE #7. Again, do not worry if the predictions in your model are slightly different than the ones shown in this tutorial document. The predictions depend on the exact size and position of the WIDGETS and yours are unlikely to be exactly the same as ours. However, if they are off by more than a few tens of milliseconds, you might compare your designs to ours to see if there are major differences.
5 Conclusion
You can continue adding new DESIGNS and new TASKS as much as you would like to explore options with your DESIGN. You can group tasks either as alternatives (as we did in the tutorial example) or as subtasks that add up to a whole task denoted by A TASK GROUP. Breaking a whole task into subtasks lets you explore alternatives for parts of a task instead of having to demonstrate the entire task each time (which can get tedious for longer tasks).
PS. Don’t forget to look at the “Two More Fun Things” on the next few pages.
6 Two More Fun Things
6.1 Capturing Backgrounds to Move Widgets
Our tutorial example did not provide the opportunity to show a neat feature of CogTool, the ability to capture the look of a WIDGET and move it around to find a better arrangement of WIDGETS.
 Look back at Figure 16, where the “Museums” button was created on the “1-Start” FRAME. The Capture Background button on the bottom right of the window captures the bit-map within the orange WIDGET bounding box. In this case, it would be the rounded rectangle button labeled “Museums”. This
button can now be moved around to anywhere in the Frame and it retains
the look of the “Museums” button. In Figure 42, we have put the
Museums button in the middle of the Graffiti® area – a silly thing to
do, but easy to see how the feature works.
Look back at Figure 16, where the “Museums” button was created on the “1-Start” FRAME. The Capture Background button on the bottom right of the window captures the bit-map within the orange WIDGET bounding box. In this case, it would be the rounded rectangle button labeled “Museums”. This
button can now be moved around to anywhere in the Frame and it retains
the look of the “Museums” button. In Figure 42, we have put the
Museums button in the middle of the Graffiti® area – a silly thing to
do, but easy to see how the feature works.
This feature can be used to create totally new layouts from one screenshot of all the
WIDGETS in a FRAME. Simply create a FRAME with all the desired WIDGETS and capture the background for each one. Copy each WIDGET and paste it onto a FRAME with a blank or neutral background and move the WIDGETS wherever you want them to be.

Figure 42. The background of the “Museums” button WIDGET has been captured and the WIDGET has been moved to the center of the Graffiti® area.
6.2 Understanding the Predictions
The underlying computation cognitive engine that makes the predictions is called ACT-R and is very complex. To learn more about it, you can go to the ACT-R website. [http://act-r.psy.cmu.edu/]
We have built a visualization tool into CogTool so you can see what ACT-R is doing to produce the predictions. Although this visualization is meant for cognitive psychology researcher to validate CogTool’s and ACT-R’s predictions, it is fun and may entice you to learn more about computational cognitive modeling.
To see the visualization, in the PROJECT window use the contextual menu on a SCRIPT cell to select “Show Model Visualization” (Figure 43). You can open as many visualization windows as you wish, and align them to compare the execution traces and see where their times differ.


Figure 43. The Contextual menu on a SCRIPT cell for the TASK “Lookup the MET – Graffiti”.
To see what ACT-R is doing, select the “Model Trace” tab located at the top of the right pane of the window.

Figure 44. Tabs in the right pane of a visualization window.
Once both Visualization windows are open, place one above the other and resize them so you can see both windows (see Figure 45).

Figure 45. Comparison of Graffiti to Soft-keyboard methods in ACT-R visualization windows
In the left pane is a timeline showing the different activities ACT-R goes through to make the predictions. The right pane shows a textual trace of these same activities.
In the left pane, time runs from left to right and the width of the boxes are proportional to the time they take to execute. The rows of boxes are different types of “operators” that happen in the course of performing these tasks.
The top row is labeled “Frame” and shows the duration that each frame is visible as the task is performed.
KNOWN BUG #3. The frames are not actually visible as long as these boxes indicate. When there is a system wait, one frame disappears and the next one doesn’t show up for the duration of the system wait. This is not shown correctly in the current visualization. For example, frame 2-Museum_List is shown as visible at about 1.6 s into the task. It is really not visible until about 5.7 s into the task. A person well-versed in ACT-R would be able to see this discrepancy in the visualization because the vision row and the production row have many short pairs of operators between 1.6 s and 5.7 s. This pattern of operators represents the eyes trying to see the next button, but the frame not being visible, so the vision system returns a “failure” signal to cognition. As soon as the frame is visible, the vision operator is much longer, as it actually find the next button to press and returns its location to cognition.
The next row (purple) is Vision, which represents the eyes seeing objects on the frame.
The next row (grey) is labeled “Productions” (the elements of a production system, which is the type of cognitive engine that ACT-R employs), which represent the thoughts the model has when performing this task. The long boxes in this row are the Think operators. Short boxes are other types of cognitive operators that initiate motor movements motor and visual attention shifts.
The next three rows (shades of red) represent different aspects of the motor system employed by ACT-R. ACT-R’s motor system is complex and beyond the scope of this tutorial, but the bottom row (darkest red) shows the motor movement that would be observable on a video: horizontal movements of a finger, stylus, or mouse, clicks of a mouse button or key presses. In these models, only horizontal movements of the stylus is shown, because it uses a Palm device that uses a stylus (not a mouse or keyboard).
If you click on a box in the left pane, it highlights the part of the model trace that corresponds to it in the right pane.
The biggest difference between the two models evident in the timelines is that the Graffiti® model has long red motor operators where the Graffiti® gestures are (around 6.4 s and 7.2 s) and the Soft-keyboard model has much shorter motor movements to poke the M-key and the E-key. This is because Graffiti® gestures take about 0.5 seconds to complete, on average and the soft-key poking time is calculated from Fitts’s law. Offsetting this savings in motor time, the Soft-keyboard model has an additional Think operator between the M-key and the E-key that the Graffiti® model does not have between the m-gesture and the e-gesture. By default, “me” is treated as a “cognitive unit” by CogTool when entered as successive Graffiti® gestures that are not commands, and successive soft-keyboard presses are not because each key is modeled as a button. We are currently collecting data to validate these approximations. If you would like to see what the times would be if the Think operator was not inserted between the M-key and the E-key, simply delete it from the script and close and compute. (Deleting and inserting Think steps and System Wait steps are the only safe modifications you can make to scripts without re-demonstrating.)
Have fun with this visualization.
handheld devices using the keystroke-level model. Proceedings of CHI, 2005 (Portland, OR, April 2-7, 2005) ACM, New York.
-
Luo, L. & John, B. (2005) Predicting task execution time on ↩